
What Happened
Last month, EPA scientists published a peer-reviewed study finding a “strong association between [young] children’s elevated blood lead levels [EBLLs] and lead service lines” (LSLs) among those served by the water systems serving Cincinnati, Ohio, and Grand Rapids, Michigan. They found that LSL prevalence in a census tract was a stronger predictor of lead exposure risk than HUD’s Deteriorated Paint Index and EPA’s two Random Forest models. LSL prevalence was comparable to Vox’s Lead Exposure Risk. See our February 2024 blog for details on HUD’s, EPA’s, and Vox’s models.
EPA’s scientists conclude that “these findings underscore the independent contribution of LSLs to children’s lead exposure and support LSL replacement as an effective public health strategy.” They state that “our analysis suggests that LSL prevalence can enhance the identification of [lead] exposure risk hotspots … by combining LSL data with existing indices based on publicly available housing age data.”
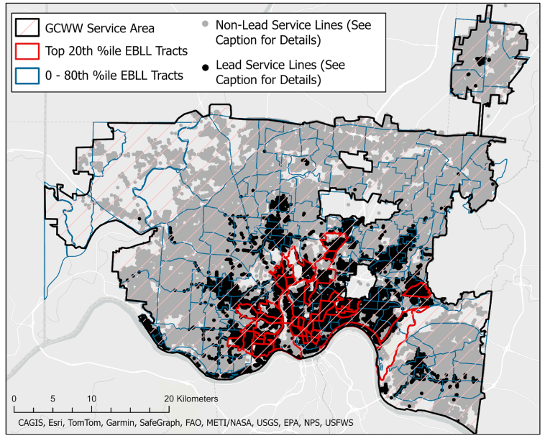
The researchers focused on Greater Cincinnati Water Works (GCWW) and Grand Rapids Water System (GRWS) because: 1) they previously collected complete 2014-16 blood lead level data in those states; 2) the utilities had optimized corrosion control systems to reduce lead leaching into drinking water and had stable water quality conditions during 2014-16; and 3) the water systems had geocoded, address-level data for all of their service lines that included whether the lines were LSLs, never LSLs, replaced LSLs, or of unknown composition. See interactive map for GCWW and GRWS. The water systems had the added advantage that they had almost no service lines of unknown composition (only 662 out of 292,944) which simplified the analysis, a factor that set the two water systems apart from most drinking water utilities.
Why it Matters
Concerted efforts at the federal, state, and local levels to drive young children’s lead exposure closer to zero have resulted in tremendous progress, yielding major long-term benefits to society. Through research by Bruce Lanphear and many others, EPA rigorously vetted algorithms that quantify those benefits and show a huge return on the investment.
A critical tool in focusing those efforts has been CDC’s blood lead action level1 that helps identify young children most in need of case management. CDC’s action levels also enable epidemiologists to identify “hotspots,” essentially communities where a more systematic effort to reduce lead exposure is warranted. As those action levels have dropped from 10 micrograms per deciliter (µg/dL) to 5 µg/dL in 2012 and then again to 3.5 µg/dL in 2021, it has become increasingly clear the sources of lead go well beyond lead-based paint and successful efforts need to consider those sources.
In a series of groundbreaking articles2 beginning in 2022, EPA’s scientists, supported by their colleagues at HUD and CDC, have focused on developing and refining models to identify and map geospatial hotspots at the census tract level. Their impressive research has helped us realize that rural areas warrant greater focus and now, that lead service lines, the primary source of lead in residential drinking water are also associated with hotspots. See our February 2024 blog on the hotspot study.
Our Take
EPA’s analysis for Cincinnati and Grand Rapids provides important insight for those two cities. However, the model must be used with caution due to several shortcomings. First, those two large water systems are unusual because they know where their LSLs are. For most cities, the composition for a large portion of their service lines is unknown. That will change in 2034 when EPA’s Lead and Copper Rule (LCR) requires that utilities validate the accuracy of their service line inventory.
Second, EPA’s analysis grouped the data by census tract. Despite having address-level data on LSLs in both cities, the scientists did not connect those addresses to homes where children with EBLLs lived or whether those homes had lead-based paint.3 That analysis may have provided greater insight into the correlation between LSLs and EBLLs. Note that they may not have had access to the data from the state or local health departments.
In addition, EPA did not consider two important issues that could explain why Grand Rapids had a stronger correlation with LSL prevalence than Cincinnati.
- Cincinnati prohibited new LSLs after 1927. Most utilities prohibited new LSLs much later with GRWS in the 1950s and Chicago Department of Water Management in 1986 (when Congress banned the practice nationally). Since lead-based paint was also phased out in the 1950s and it is a significant source of children’s lead exposure, you would expect Grand Rapids to track more closely.
- Did not consider Cincinnati’s airport. Unlike in Grand Rapids where EPA acknowledged the presence of an airport, EPA made no mention of the Cincinnati’s Lunken Airport. Both airports are in a census tract with the top 20th percentile of EBLLs, yet have almost no LSLs. This omission is particularly important since the Cincinnati airport caters to small engine airplanes that still use leaded gasoline.
More broadly, the study raises an important difference between LSLs and lead-based paint or lead-contaminated soil as a source of lead exposure. Because of EPA’s LCR revisions in 2021 and improvements in 2024, we have address-level information on the presence of LSLs for those served by community water systems. In contrast, we lack address-level information for lead-based paint in all but a handful of states: Maryland, Massachusetts, and Rhode Island currently for rental property with New Jersey and New York getting it in coming years). This difference is a problem because the high EBLLS we all-too-often see in children is primarily from lead-based paint. We should be looking at ways to map the presence of lead-based paint at the address level.
- CDC’s terminology has changed over the years. We use the term “action level” to be consistent with EPA’s terminology for water and dust-lead, FDA for food contaminants, and OSHA for workers. We believe it is a more useful—and less abstract—term than CDC’s current “blood lead reference value.” ↩︎
- See Zartarian, et al., 2022 (explaining the approach); Xue, et al., 2022 (Michigan case study); Stanek, et al., 2024 (Ohio case study); and Zartarian, et al., 2024 (hotspot analysis). They have also modeled relative source contributions of lead to young children’s exposure (Zartarian, et al, 2017); and on drinking water interventions (Stanek, et al., 2020). ↩︎
- The state would only have this information it conducted an environmental investigation, which were not done for EBLLs down to 3.5 µg/dL in 2014-16. ↩︎