
What Happened
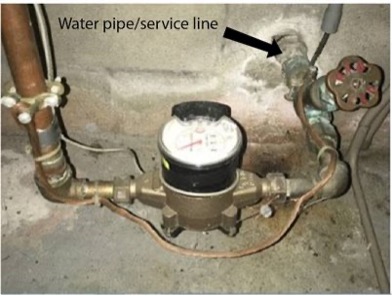
EPA released an impressive dashboard in late November that provides topline information regarding service lines for each of more than 66,500 water systems. Service lines are the pipes connecting water mains under the street to buildings or homes. There are roughly 100 million service lines in the United States.1
Lead services lines (LSL) are the primary source of lead in drinking water.2 EPA’s Lead and Copper Rule (LCR) requires water systems to replace LSLs they can access by 2037.3 It also requires it for galvanized steel lines that are or may have been downstream of an LSL (also known as “galvanized requiring replacement” or GRR).
EPA used the new information to:
- Revise downward the projected number of LSLs and GRRs that need to be replaced by 2037 from 9 million to 4 million; and
- Based on the projections, allocate the $3 billion in FY25 LSL Replacement Program funds provided by Congress as part of the Bipartisan Infrastructure Law (BIL).4
EPA also redistributed an additional $1.1 billion in unclaimed funds that it made available to states in prior years.
Ten States and Cities with the Most Project LSLs and GRRs
Based on EPA’s dashboard and methods, Unleaded Kids has ranked the states and the water systems with the largest projected number of LSLs and GRRs. EPA has posted projected totals for all states.
| States with the Most Projected LSLs and GRRs | ||||
| State | Projected LSLs and GRRs | Lead & GRR Reported | Unknown Reported | Total Service Lines |
| Illinois | 632,000 | 477,000 | 939,000 | 3,839,000 |
| Ohio | 407,000 | 321,000 | 867,000 | 3,604,000 |
| New York | 383,000 | 290.000 | 948,000 | 3,778,000 |
| Michigan | 294,000 | 259,000 | 315,000 | 2,611,000 |
| Pennsylvania | 265,000 | 109,000 | 2,343,000 | 3,853,000 |
| Indiana | 262,000 | 173,000 | 708,000 | 2,096,000 |
| New Jersey | 207,000 | 135,000 | 861,000 | 2,522,000 |
| Wisconsin | 193,000 | 169,000 | 208,000 | 1,437,000 |
| Texas | 144,000 | 114,000 | 2,292,000 | 9,348,000 |
| Missouri | 117,000 | 66,000 | 965,000 | 2,177,000 |
| Total | 2,904,000 | 1,823,290 | 10,446,000 | 32,656,611 |
| % of US | 73% | 61% | 43% | 33% |
| Water Systems with Most Projected LSLs and GRRs | ||||
| Community | Projected LSLs and GRRs* | Lead & GRR Reported | Unknown Reported | Total Service Lines |
| Chicago | 333,000 | 161,000 | 252,000 | 487,000 |
| Cleveland | 167,000 | 145,000 | 57,000 | 434,000 |
| New York City | 146,000 | 124.000 | 125,000 | 820,000 |
| New Orleans | 108,000 | 14,000 | 108,000 | 123,000 |
| Detroit | 96,000 | 81,000 | 39,000 | 251,000 |
| Pittsburgh (Pennsylvania American Water) | 93,000 | 5,000 | 218,000 | 231,000 |
| Philadelphia | 91,000 | 15,000 | 436,000 | 525,000 |
| Milwaukee | 88,000 | 69,000 | 34,000 | 161,000 |
| Buffalo | 64,000 | 34,000 | 36,000 | 77,000 |
| Indianapolis (Citizens Water) | 64,000 | 34,000 | 40,000 | 375,000 |
| Total | 1,250,000 | 558,124 | 1,345,000 | 3,484,000 |
| % of US | 31% | 19% | 6% | 3.5% |
| * EPA did not provide projected numbers for each water system. These are estimates from Unleaded Kids using EPA’s formula. | ||||
Why It’s Important
The new information in EPA’s dashboard is more reliable than previous estimates because it is based on mandatory reports by all water systems to their state.5 In those reports, water systems had to designate each and every service line in their system as either an LSL, GRR, lead status unknown (“unknown”), or non-lead. The states summarized the information in reports to EPA, providing totals of each of the four categories. Note that in a quirk of the 2021 revisions to the rule, states were not required to provide EPA with water system totals for non-lead service lines. All but Maryland and New Hampshire appear to have voluntarily provided this information.
For many years, the agency relied on an estimate of 6.1 million LSLs published in 2016 based on surveys conducted in 2011 and 2013 of almost 1,000 community water systems by the American Water Works Association (AWWA). In 2023, EPA estimated there were 9 million LSLs (including GRRs) based on responses by more than 2,000 water systems as part of its 7th Drinking Water Infrastructure Needs Survey and Assessment (DWINSA).
Is EPA’s Projected 4 Million LSLs and GRRs Realistic?
Yes. EPA used a reasonable method to make the estimate based on the data it received. That said, it is still an estimate. From Unleaded Kids’ review of the data, it appears low and may end up at 5 million, still well below 9 million.
We will know more after water systems submit updated service line inventories to their state in October 2027, and state’s roll that information into totals they submit to EPA in early 2028.
Why did EPA’s Projects Number of LSLs and GRRs Drop from 9 to 4 Million?
EPA’s estimate of 9 million LSLs and GRRs from the 7thDWINSA survey was based on responses from 72% of 2,888 medium and large water systems. For small systems, the agency surveyed almost 700 systems and extrapolated from the 19% who responded.
Those water systems responding to the survey reported 5.1 million LSLs and GRRs, 23.8 million unknowns. There were 14.5 million service lines not covered by the reports. The agency came up with its 9 million estimate based on its assessment that 3.9 million of the unknowns and unreported lines were LSLs and GRRs, about 10% overall.
The situation was entirely different for the service line inventories posted in the dashboard because:
First, all water systems were obligated to report. Almost all of the 1,081 water systems serving more than 50,000 people reported as required, and 85% of all water systems responded. Rather than make an estimate, EPA counted those who did not respond as having only non-lead service lines with no LSLs or GRRs. This is a reasonable approach, but it is likely an undercount since some of the 10,000 water systems failing to report had some service lines to replace.
Second, water systems must make public the designation of each and every service line. They also had to send a letter to every customer with an LSL, a GRR, or an unknown, along with guidance on next steps in October 2024. They must keep sending the notices annually until all service lines are non-lead.
We expect that this level of transparency prompted water systems to designate a service line as unknown instead of an LSL or GRR to avoid having a customer anticipate replacing the service line only to find it is non-lead. This commonsense approach avoids potential backlash and encourages customers to check their service line as it comes into the home or building to see if it is lead. For example, in 2022 Chicago Water told Illinois EPA that it had 409,734 LSLs and no unknowns. In 2024, it reported 150,767 LSLs with 251,569 unknowns; virtually all of the drop in LSLs was simply a redesignation of the lines to unknowns.
Third, funds from Congress enabled water systems to improve their inventories and to replace LSLs. As part of the Bipartisan Infrastructure Law, Congress dedicated $15 billion over five years to support LSL replacement programs by water systems. EPA passed this money on to states as part of the Drinking Water State Revolving Fund (DWSRF). In the first two years, most states allowed waters systems to use the funds to not just replace LSLs but also to develop and refine their service line inventories as a prelude to replacement.
This investment enabled utilities to use modern statistical tools to check a random sample of service lines so they could be more confident in their estimates. We think this resulted in service lines being designated as non-lead instead of being overly cautious and calling them unknown. In its 2024 revision to the LCR, EPA formally allowed the use of these statistical tools.
As a result of these factors as well as ongoing efforts by water systems to replace LSLs, EPA found that:
- LSLs and GRRs reported by water systems dropped dramatically—more than 60%—from 5.1 million in the 7th DWINSA Survey to 3 million in the 2025 dashboard. This drop occurred even though EPA had reports in the dashboard about 53,000 additional water systems
- Non-lead service lines reported jumped 28%, from roughly 57 million to 73 million.
- Unknowns held steady at around 24 million.
Using this updated information, EPA projected that 1 million of the 24 million unknowns (–4%) would be LSLs and GRRs. The agency made this projection by calculating for each state the ratio of reported LSLs and GRRs to total known service lines (LSLs, GRRs and non-leads).6 Illinois has the highest ratio of 1 in 6 (16.6%) to less than 1 in 100 for 15 states including Virginia, Florida, North Carolina, Washington, California, Maine, and Idaho.
- 49,354 community water systems (CWS) and 17,124 non-transient, non-community water systems (NTNCWS) were required to report pursuant to the LCR. ↩︎
- Where the lead pipe is a connector of 3 feet or less—also known as a gooseneck or pigtail—it is not a LSL. Connectors are not included in the baseline service line inventory submitted in October 2024 used in EPA’s Dashboard. Water system must include information about connectors in an updated service line inventory that is due November 1, 2027. They must also replace lead connectors it encounters during planned or unplanned water system infrastructure work unless the connector is not under the control of the system. ↩︎
- States can grant a water system a deferred deadline if more than 3.9% of the service lines must be replaced. ↩︎
- More formally known as the Infrastructure Investment and Jobs Act (IIJA) of 2021. ↩︎
- It includes District of Columbia, the territories, and Navajo Tribe. ↩︎
- Where states like Maryland and New Hampshire did not voluntarily report the number of non-lead service lines, EPA “filled system-level gaps in non-lead service line information using the total number of service connections reported in the Safe Drinking Water Information System.” ↩︎