
What Happened?
Last month, we summarized a significant study by EPA, HUD, and CDC mapping the nation’s potential lead exposure hotspots at the census tract level that helped people visually understand where to prioritize efforts. In this blog, we focus on maps developed by four states:
- Ohio’s Lead Hazardous Properties: The Ohio Department of Health maps individual properties whose owners have refused to comply with an order to correct known lead hazards. You can zoom in on the map and add filters. It also has a helpful option to export the list. As of March 12, 2024, there were 1,185 properties on the list, each declared unsafe for human occupation.
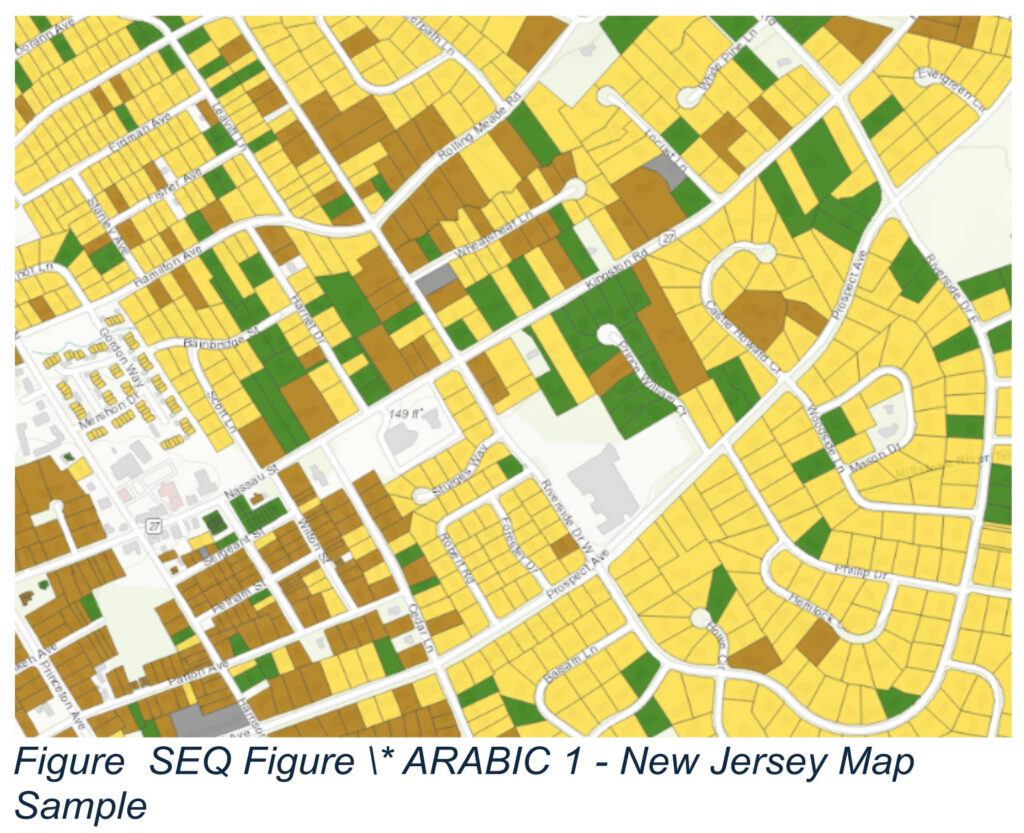
- New Jersey’s Potential Lead Exposure Mapping (PLEM) Tool: Three state agencies collaborated to map all residential properties categorized by the year constructed (in four groups: before 1950, 1950–78, post-1978, and unknown). You can zoom in and click on a property to get its address and year constructed, along with averages for the municipality for helpful context. For each census tract, you can select one of two layers: 1) number of one- and two-family rental properties built before 1980; or 2) whether dust wipe sampling is required because more than 3% of the young children in a municipality had a blood lead level of 5 micrograms per deciliter (µg/dL) or more. The state plans to expand to show other potential lead sources.
- Indiana’s Childhood Lead Risk Level: The Indiana Department of Health maps census tracts assigned to one of five color-coded categories based on the calculated “child lead exposure risk.” The risk is based on five factors that the state finds are most correlated with elevated blood lead levels: 1) homes built before 1940; 2) homes built between 1940 and 1949; 3) homes within 1.6 miles of a current or historic lead-emitting facility (based on Toxic Release Inventory reports from 1988–2022); 4) children under age five living in poverty; and 5) black population.
- California’s Geospatial Indicators for Risk of Childhood Lead Exposure: Static map of census tracts assigned to one of four color-coded categories based on how many of eight indicators of the risk of childhood lead exposure are present. The indicators are: 1) at least 25% of homes built before 1978; 2) served by a water district with at least one known leaded “user service line” or fitting; or 3) within 1.7 miles of current or historic lead-emitting facility; 4) within 1,000 feet of a state highway; 5) in a city with a known current or historic smelter; 6) within 1 kilometer of an airport using leaded aviation gas; 7) within 1 kilometer of a railroad; or 8) within 1,000 feet of a speedway. It also has a helpful option to export the list.
We are also aware that 120Water is working with several states to publish a map of all service lines in a state indicating whether the pipe is lead, galvanized, made of unknown materials, or made of other materials. Public water systems are required to submit this information to their state drinking water agency before October 16, 2024, pursuant to the Lead and Copper Rule. Systems serving more than 50,000 people must also make the information available online.
In addition, starting in October, public water systems are required to annually notify owners and residents of each property that has a lead service line or one where the material may be lead but is unknown.
Why it Matters
State maps of lead hazards help people visually understand the risks for their state or their community. When they are interactive, they serve as useful means to access detailed information about those risks.
The maps are especially valuable when they provide information for each address as New Jersey does. Address-specific information engages residents, potential home buyers, and renters, so they can make more informed decisions about protecting their families from harmful lead exposure.
Our Take
We applaud these four states for developing and publishing their maps and encourage others to adapt these examples for their situations. Even if only at the census tract level like Indiana and California, they provide important context that people can use, especially as additional address-specific information about lead service lines, lead-based paint, or other sources of lead exposure becomes available.
Ohio’s “name and shame” approach for those properties whose owners have refused to comply with a clean-up order has real value because it pressures them to fix the problem and incentivizes others, so they avoid getting on the list. Other states should follow this example. Hopefully, Ohio will expand the map to include all properties that have been covered by clean-up orders so buyers or renters can make sure they receive information about the lead-based paint hazards that were present; they may reoccur if not fully abated.
We are particularly impressed with New Jersey’s map because it has both address-specific information and helpful context so people better understand what they might do to reduce exposure. We look forward to seeing the state add more information about potential lead sources.
Finally, we encourage states such as Massachusetts, Maryland, and Rhode Island that have extensive information on hundreds of thousands of homes in their states but lack a mapping function to make it much more accessible.
- Massachusetts’ online search tool requires a city and an approximate street name. Make sure you watch the videos for instructions.
- Maryland has an online search tool that requires the specific address and county. There is no mapping function, and the search tool is far less flexible than Massachusetts.
- Rhode Island has an online tool that provides all the addresses of rental properties that have or have had a lead certificate issued. Search bars on the left narrow the properties that are listed.
If you know of any current or planned online maps of state lead risks, please let us know at tneltner@unleadedkids.org.
Next Steps
We will continue to highlight states and communities that are leading the way on maps and pressing for them to take advantage of the readily-available tools to provide more transparency and context to their constituents.
Note: Updated on August 26, 2024 to revise link to updated Ohio map