
This is the second blog in a series focused on important tools that people can use to quantify the societal benefits of reducing lead exposure. To find the series, click on “Societal Benefits” in the Categories menu to the right.
What Happened
In support of its October 2024 rulemakings1 that tightened standards for lead in drinking water and lead in interior dust, EPA updated its formula to quantify the increase in lifetime earnings of a typical child expected to result from reduced blood lead levels.
As an example of the new formula, a 10% reduction in a blood lead level would increase the average per child’s IQ from 0.14 to 0.36 points resulting in increased lifetime earnings from $5,900 to $15,100. If this increase were typical for all 3.6 million children born in a year, the societal benefit would be $21 billion to $54 billion per year. For context, the estimated IQ-related societal benefits for EPA’s Lead and Copper Rule Improvements were $6.8 billion to $11 billion per year and its Dust Lead Standard were $831 million to $3.1 billion per year.
Unleaded Kids has developed an Excel Spreadsheet to help those wanting to make their own calculations. See end of blog for details.
Why it Matters
While framing the expected health benefits from reducing lead exposure in terms of dollars can appear crass, it is an important tool to help compare priorities or to evaluate options in rulemaking.
Almost 25 years ago, EPA established standards for lead-based paint hazards. In setting the standards, the agency conducted a groundbreaking economic analysis that showed the societal benefits were as high as 2.8 times the cost based solely on the quantified benefit of increased lifetime earnings from increased IQ levels that were expected to result from lower blood lead levels.
Since that time, research by Lanphear et al. in 2019, Crump et al. in 2013 and others have provided a more sophisticated understanding of the relationship between blood lead levels and IQ. In addition, the estimated lifetime earnings from an increased IQ point have shifted as well.
Our Take
Spotting the loss of an IQ point in a child is not possible. However, powerful statistical tools evaluating tens of thousands of children enable us to “see” the loss in terms of public health and societal impacts so we can make informed decisions.
Fortunately, researchers like Lanphear, Crump, and many others have invested much of their careers in gathering data, developing those statistical tools, and refining the analysis based on feedback and peer review. After the researchers published the tools, EPA rigorously:
- Reviewed all available studies that could be used to develop quantitative relationships between changes in lead exposure and/or changes in blood lead levels and changes in key health endpoints.
- Evaluated the studies for quality and potential biases.
- Developed a separate report for each health endpoint. In addition to the quality review findings, each report provides quantitative estimates, based on the identified functions, of potential changes in the health endpoint.
- Had the reports for quantified health endpoints reviewed by EPA experts and external peers.
- Successfully completed inter-agency review of the approaches through White House’s Office of Management and Budget.
Only then are we able to sufficiently quantify the societal benefits of reducing lead exposure for use in federal rulemaking. And even then, EPA recognizes the uncertainty and provides a range of estimates.
Details on Calculating Lifetime Earnings Increase from Reducing Lead Exposure
Unleaded Kids reviewed Section 5.5.1 and 5.5.2 of EPA’s Economic Analysis for its Lead and Copper Rule Improvements and developed an Excel Spreadsheet to help those wanting to make their own calculations. The instructions are in the spreadsheet. Click here for a PDF of the worksheet. Click here for the key pages from EPA’s economic analysis explaining the formula.
To estimate the IQ benefits of a given change in blood lead levels, EPA used and Lanphear et al., 2019 for the high-end (Equation 9 below) and Crump et al., 2013 for the low-end (Equation 10).
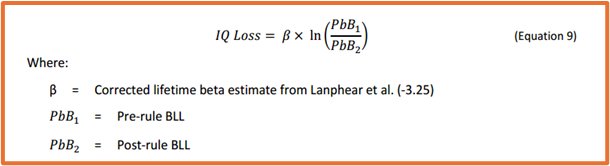
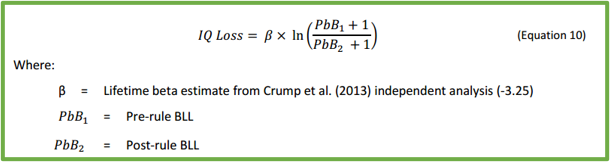
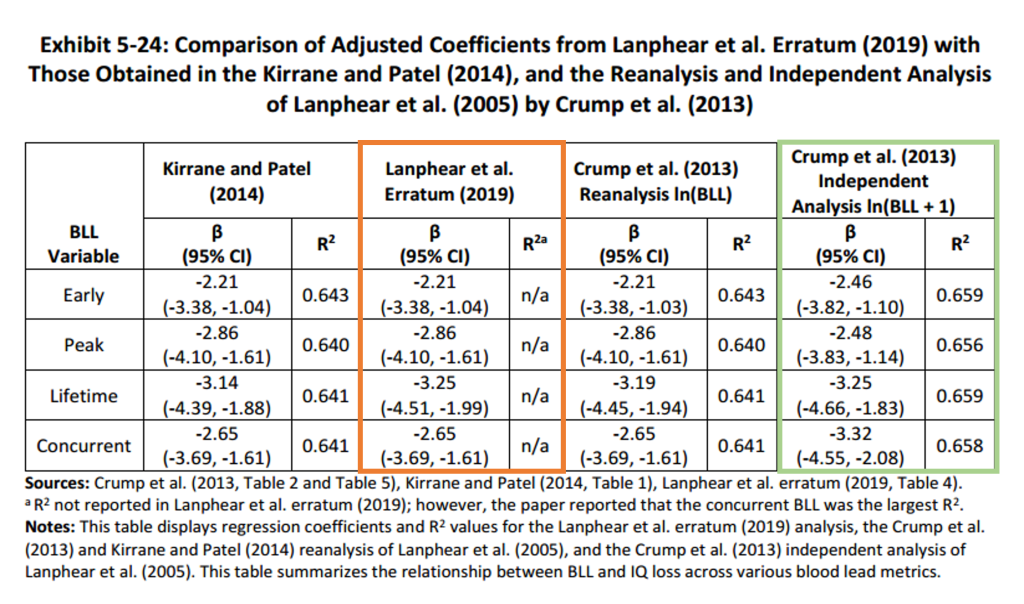
Exhibit 5-24 provides β for each equation. EPA used the central lifetime beta estimates.
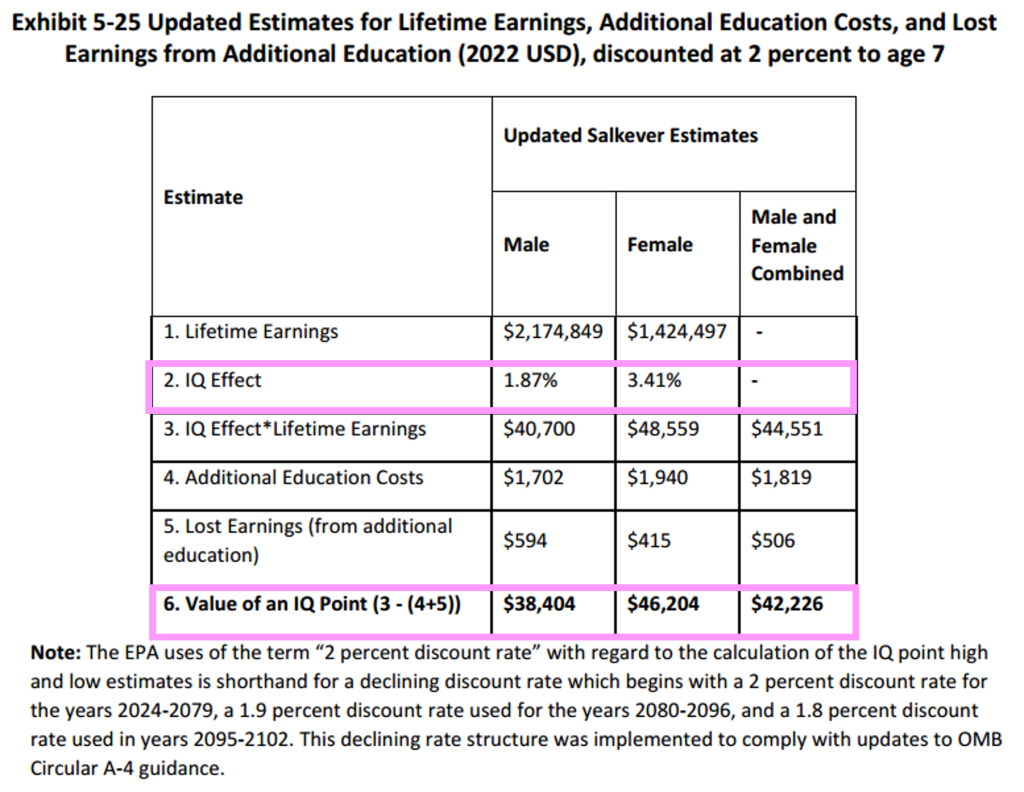
From the low-end and high-end IQ changes, you use the valuation estimates from Exhibit 5-25 to calculate the change in lifetime earnings due to changes in IQ loss using a 2% discount rate as recommended by OMB.